rhondamuse.com

Monitor Your System Efficiently with Btop: A Comprehensive Guide

Written on

Chapter 1 Understanding System Monitoring

Monitoring your system's performance is crucial, especially if you’ve noticed your computer lagging. While Btop might not provide a complete diagnosis, it highlights potential issues, such as processes consuming excessive CPU resources or a full swap partition. Traditional commands like ps, df, or swapon can be helpful, but Btop consolidates everything you need into a single interface.

Installation Process

You can install Btop through various package managers. For instance, on the latest version of Ubuntu, you can use the following command:

sudo apt install btop

Additionally, a snap package is available for easy installation. Btop is open source and can be installed directly from binaries; detailed instructions can be found in the GitHub repository. If you’re a Mac user, you can easily install Btop via Homebrew:

brew install btop

Unfortunately, Windows users currently have no support for Btop.

Chapter 2 Navigating Btop

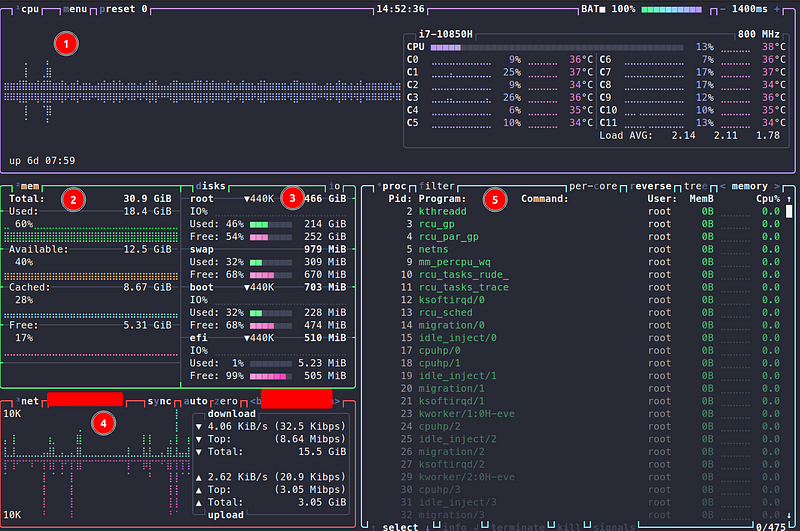
After successfully installing Btop, launch it in your terminal, and you will see five distinct panels.

Btop interface showing CPU and memory usage

The first panel presents your CPU usage and temperature, broken down by each core, along with an overall summary. If you’re using a laptop, it also displays battery status. Pressing '1' will hide this panel if you wish.

The second panel provides detailed memory usage statistics, including total, available, cached, and free memory. You can toggle this panel by pressing '2'. 'Used' indicates the memory currently in use by applications, while 'Available' refers to memory that can be repurposed by the system as needed. Cached memory consists of disk files stored in RAM for faster access, and 'Free' memory is simply that—unallocated memory.

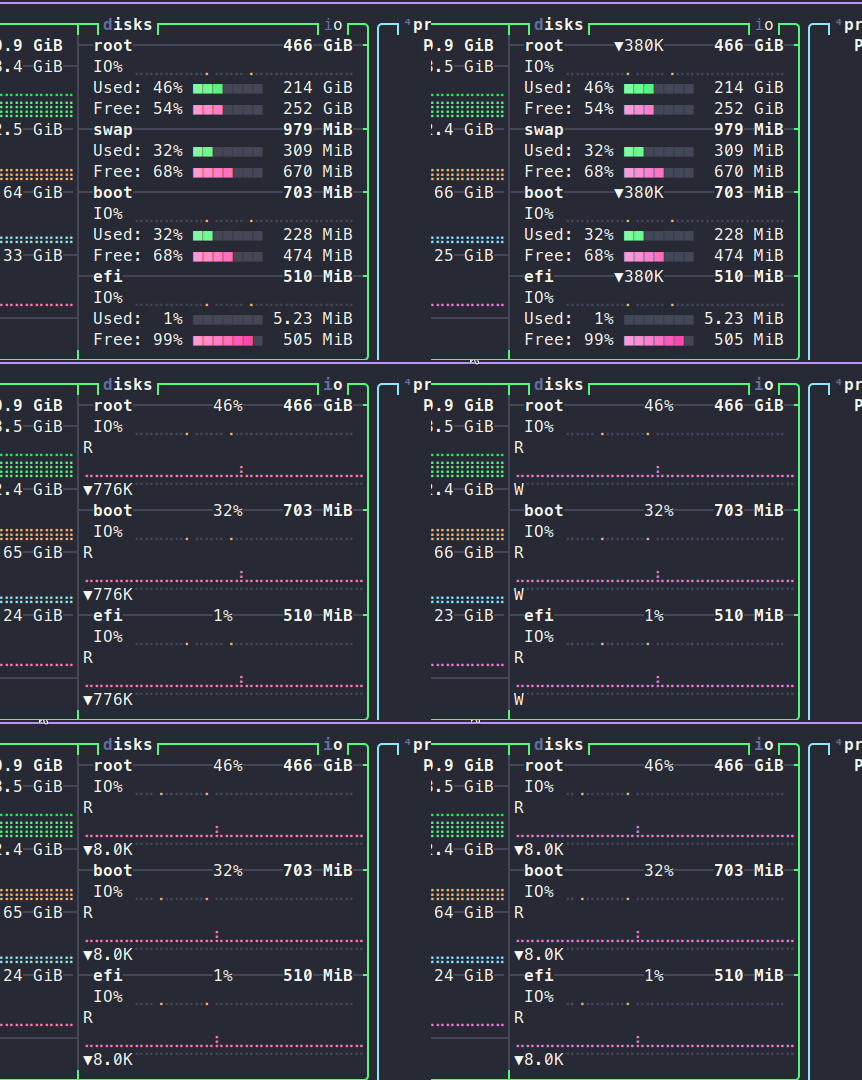
Panel three displays used and free disk space, categorized by mount points. Press 'd' to conceal this panel, and pressing 'i' will show current read and write operations.

Disk space usage panel in Btop

The fourth panel reveals network traffic. You can hide it by pressing '4', and to view other network devices such as Ethernet or Wi-Fi, simply press 'b' or 'n'. The fifth panel offers the most granular details, showcasing all active processes along with their thread usage, memory consumption, CPU load, PID, and the user who initiated them. You can navigate through the list using the arrow keys, and sort the data by pressing left or right arrows. To reverse the sorting order, press 'r'.

Detailed process information in Btop

Selecting a process and hitting enter will provide additional details, allowing you to terminate, kill, or send signals to it.

Chapter 3 Customization and Features

Btop is not only functional but also customizable. It includes twenty different color themes; I personally prefer the Dracula theme. You can adjust the UI to fit your preferences, such as disabling rounded corners or modifying the graph symbols and clock formats.
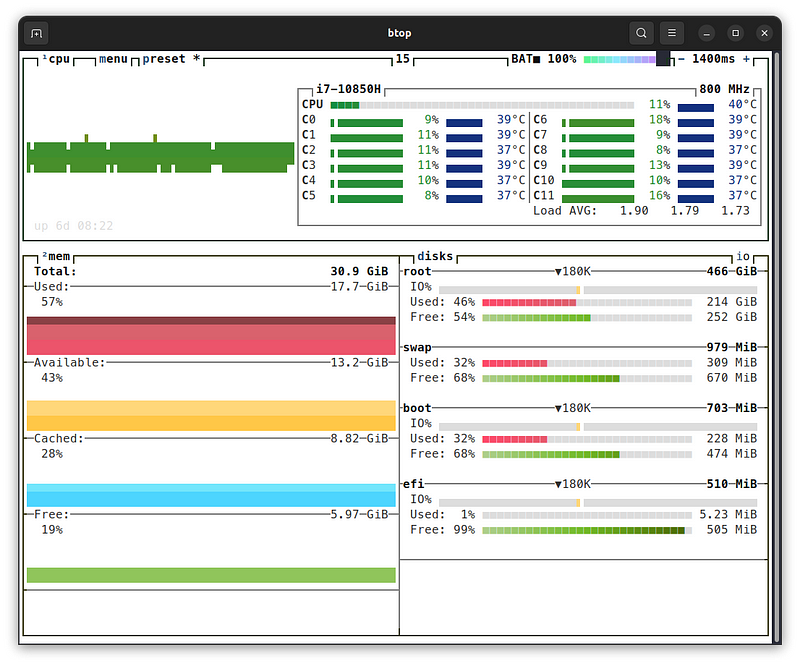
Btop showcasing a custom theme

Moreover, you can alter the default settings of the panels, such as adding an extra graph to the CPU panel to display usage in alternative modes.
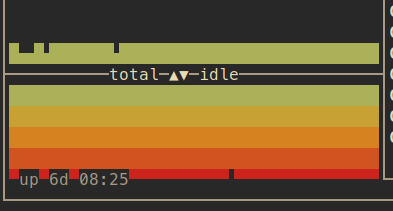
Btop CPU panel displaying alternative usage metrics

Btop also supports mouse interaction, allowing you to scroll through the process list using your mouse wheel. Configuration settings are saved in a file located at $HOME/.config/btop, making it easy to share your presets with colleagues. You can even create your own themes by following the format available on GitHub and placing them in $HOME/.config/btop/themes.

Recap and Resources

In summary, Btop serves as a versatile tool for monitoring your machine's resources. I hope you find it as beneficial as I do. For more information, here are some useful links:

  • Btop’s GitHub repository
  • Homebrew for Mac
  • Information about Linux memory management
  • Btop on SnapCraft

Thank you for reading!

Want to Connect? Subscribe to my newsletter to stay updated:

Explore amazing CLI dashboards like BTop++, Bottom, and Zenith for effective system monitoring.

Learn how to install BpyTop, the essential system monitoring command-line tool for Linux.
Share the page:

Twitter Facebook Reddit LinkIn

-----------------------

Recent Post:

The Intricate Relationship Between AI, Creativity, and Paradoxes

A deep dive into Douglas Hofstadter's insights on AI and creativity, exploring the paradoxes of mind and meaning.

Unlocking the Potential: How Much Can You Earn from a Single Medium Story?

Discover the theoretical maximum earnings from a single story on Medium, exploring assumptions and calculations behind the numbers.

# Version 12.0 Updates for the Sumner-Winters Family of West Nyack

Discover the latest features and enhancements in Version 12.0 for the Sumner-Winters family platform, including a divorce saga and more.